准备工作
shp文件是一个矢量文件,可以用来绘制地图,包括guangdong.dbf(属性表)、guangdong.shp(地图信息)、guangdong.shx(索引信息)。
cursor是什么?
Cursor.so 是一个集成了 GPT-4 的国内直接可以访问的,优秀而强大的免费代码生成器,可以帮助你快速编写、编辑和讨论代码。 它支持多种编程语言,如 Python, Java, C#, JavaScript 等,并且可以根据你的输入和需求自动生成代码片段。 Cursor.so 还可以帮助你重构、理解和优化代码,提高开发效率。
代码生成
使用geopandas
import geopandas as gpd
import matplotlib.pyplot as plt

# Read the shapefile
gdf = gpd.read_file('guangdong.shp', encoding='utf-8')

# Plot the map
gdf.plot()

# Show the plot
plt.show()
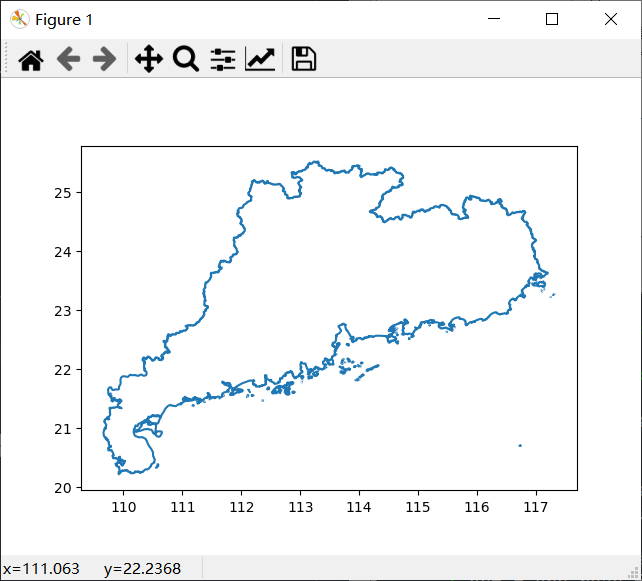
结果如下:

folium和geopandas
folium 建立在 Python 生态系统的数据应用能力和 Leaflet.js 库的映射能力之上,在Python中操作数据,然后通过 folium 在 Leaflet 地图中可视化。
import geopandas as gpd
import folium

# Read the shapefile
gdf = gpd.read_file('guangdong.shp', encoding='utf-8')

# Set the CRS of the GeoDataFrame
gdf = gdf.set_crs('EPSG:4326')

# Create a new map
m = folium.Map(location=[23.5, 116.5], zoom_start=7)

# Add the shapefile to the map
folium.GeoJson(gdf).add_to(m)

# Save the map as an HTML file
m.save('map.html')
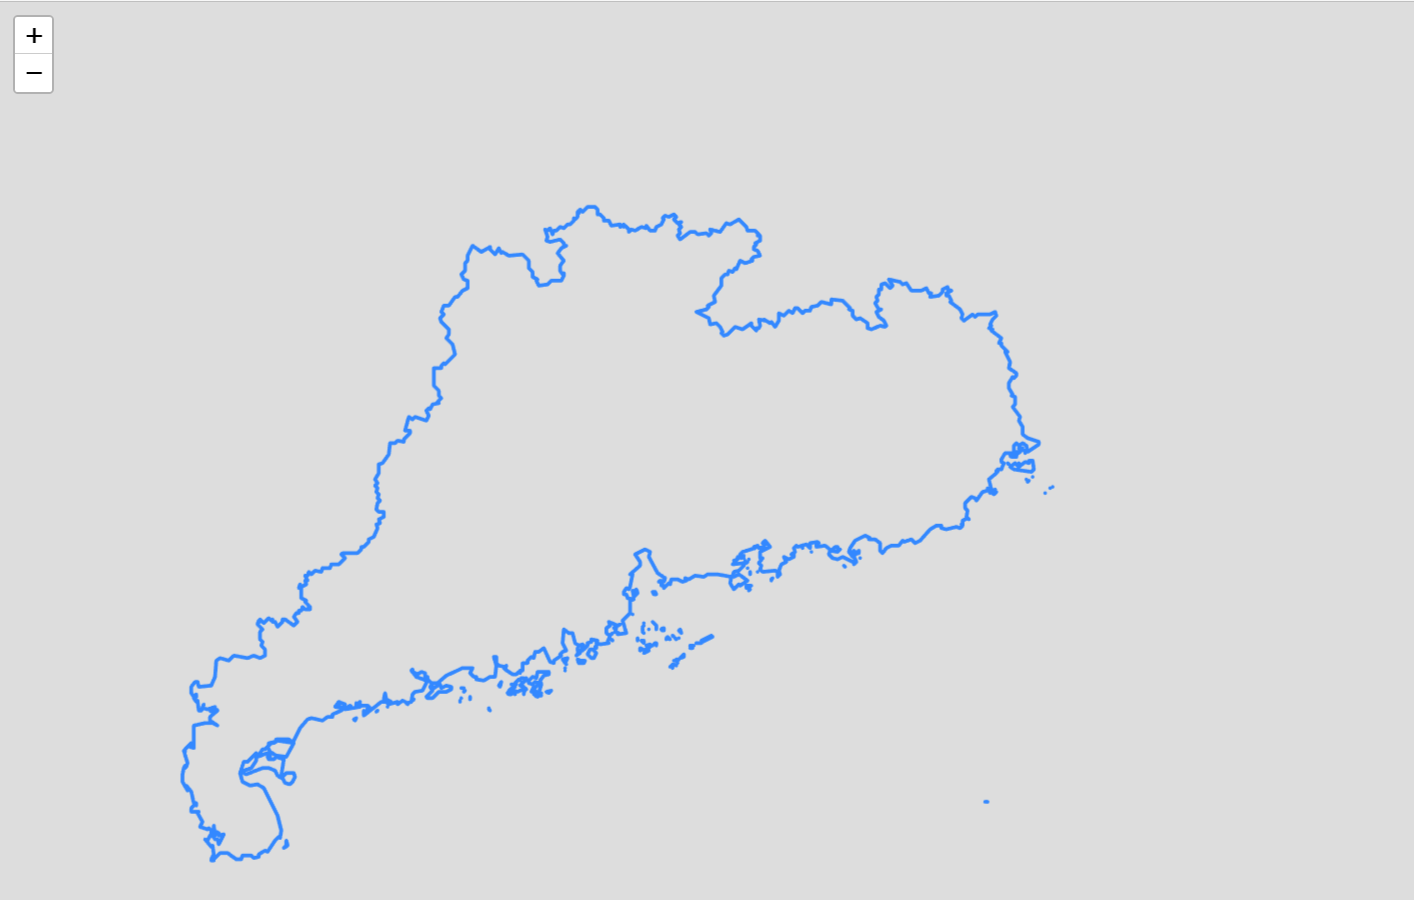
结果如下:

使用shapefile
import shapefile
import matplotlib.pyplot as plt

# Read the shapefile
sf = shapefile.Reader("guangdong.shp")

# Plot the map
for shape in sf.shapeRecords():
    x = [i[0] for i in shape.shape.points[:]]
    y = [i[1] for i in shape.shape.points[:]]
    plt.plot(x, y)

# Show the plot
plt.show()

# %%
import shapefile
import matplotlib.pyplot as plt

# Read the shapefile
sf = shapefile.Reader("guangdong.shp")
shapefile2
import shapefile
import matplotlib.pyplot as plt

# Read the shapefile
sf = shapefile.Reader("guangdong.shp")

# Plot the map
for shape in sf.shapeRecords():
    x, y = zip(*shape.shape.points)
    plt.plot(x, y)

# Show the plot
plt.show()
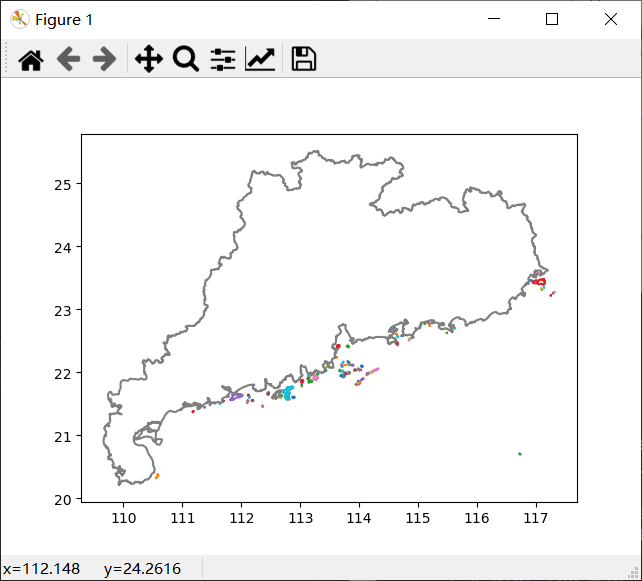
结果如下:

使用basemap
from mpl_toolkits.basemap import Basemap
import shapefile
import matplotlib.pyplot as plt

# Read the shapefile
sf = shapefile.Reader("guangdong.shp")

# Create a new map
m = Basemap(llcrnrlon=109, llcrnrlat=20, urcrnrlon=118, urcrnrlat=26, projection='lcc', lat_1=33, lat_2=45, lon_0=100)

# Plot the map
for shape in sf.shapeRecords():
    x, y = zip(*shape.shape.points)
    x, y = m(x, y)
    m.plot(x, y, 'k-', linewidth=0.5)

# Show the plot
plt.show()
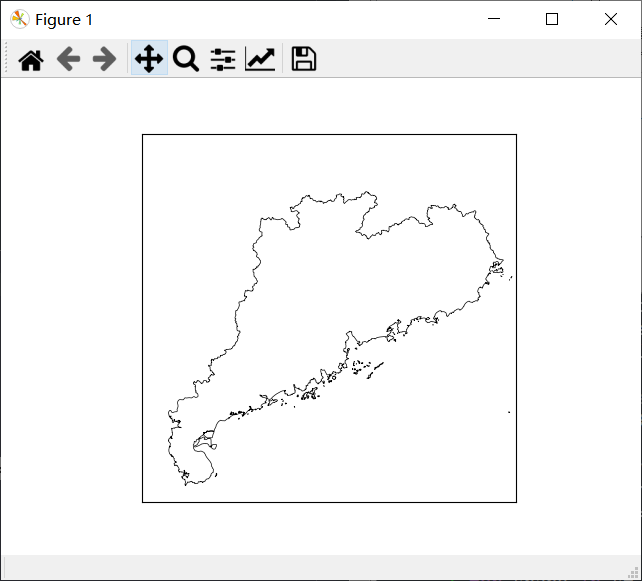
结果如下:


