1. 数据来源
2. 数据探索
import numpy as np # linear algebra
import pandas as pd # data processing, CSV file I/O (e.g. pd.read_csv)
import matplotlib.pyplot as plt
from mpl_toolkits.basemap import Basemap

# Input data files are available in the "../input/" directory.
# For example, running this (by clicking run or pressing Shift+Enter) will list the files in the input directory

from subprocess import check_output
print(check_output(["ls", "../input"]).decode("utf8")) # ls表示列出当前目录下的文件,check_output表示执行命令,decode表示解码

wtfile='../input/windTurbines.csv'
wtdat=pd.read_csv(wtfile)
print(wtdat.head())
结果如下:
   FID  unique_id                               site_name  total_turb  \
0    0        982                  unknown Gilliam County           2
1    1       1065                  unknown Gilliam County           2
2    2       1895                     Banner Wind Project           2
3    3       1897                     Banner Wind Project           2
4    4       2608  unknown Tehachapi Wind Resource Area 1         549

     on_year year_range  on_year_s    manufac    model type_tower  ...  \
0    unknown    unknown     -99999    unknown  unknown    unknown  ...
1    unknown    unknown     -99999    unknown  unknown    unknown  ...
2       2008         no       2008  Entegrity     EW50    trestle  ...
3       2008         no       2008  Entegrity     EW50    trestle  ...
4  1982_1990        yes       1982    unknown  unknown   monopole  ...

  conf_attr  conf_loc           WENDI_name  EIA_name  FAA_jdate   FAA_AGL  \
0         0         0              unknown   unknown    2013192    124.09
1         0         0              unknown   unknown    2013192    124.09
2         2         2  Banner Wind Project   unknown    2009065     38.72
3         2         2  Banner Wind Project   unknown    2009065     38.72
4         0         2              unknown   unknown     -99999 -99999.00

     FAA_ORS        image_name  image_year  \
0  41-020577  Bing Maps Aerial     unknown
1  41-020578  Bing Maps Aerial     unknown
2  02-020064  Bing Maps Aerial     unknown
3  02-020070  Bing Maps Aerial     unknown
4    unknown              NAIP        2012

                                            comments
0  FAA lists as Dismantle, google temporal analys...
1  FAA lists as Dismantle, google temporal analys...
2  trestle turbines removed, new monopoles instal...
3  trestle turbines removed, new monopoles instal...
4

[5 rows x 32 columns]
数据描述如下:
字段名称 解释说明
FID 文件编码ID
unique_id 唯一识别码
site_name 地点名称
total_turb 发电机数量
on_year 服役时间
year_range 服役时间区间
on_year_s 服役开始时间
manufac 制造商
model 型号
type_tower tower的种类
decommiss 是否退役
MW_turbine 电机的MW
total_cpcy 总的cpcy
total_ht 总的高度
tower_h tower的高度
blade_l 叶片的长度
rotor_dia 电机转子的直径
rotor_s_a 电机转子的面积
lat_DD 纬度
long_DD 经度
state 所属的州
county 所属的郡
conf_attr conf的attr
conf_loc conf的位置
WENDI_name WENDI的名称
EIA_name EIA的名称
FAA_jdate FAA的注册日期
FAA_AGL FAA的AGL
FAA_ORS FAA的ORS
image_name 照片名称
image_year 照片年份
comments 评论
3. 数据可视化
在可视化之前,应该还需要对数据进行预处理,比如去除缺失值,去除重复值等等。
#% setup the map
fig,ax=plt.subplots(figsize=(20,10))

c1=(-127.6+66.1)/2
c2=(50.5+23.2)/2
m = Basemap(resolution='i', # c, l, i, h, f or None
            projection='merc',
            lat_0=c2, lon_0=c1,
            llcrnrlon=-127.6, llcrnrlat= 23.2, urcrnrlon=-66.1, urcrnrlat=50.5)
# lat_0表示地图中心的纬度,lon_0表示地图中心的经度
# llcrnrlon表示西经,llcrnrlat表示南纬,urcrnrlon表示东经,urcrnrlat表示北纬

# draw the map
m.drawmapboundary(fill_color='#46bcec') # 设置地图边界颜色, #46bcec是蓝色
m.fillcontinents(color='#f2f2f2',lake_color='#46bcec')
# 设置陆地颜色,#f2f2f2是灰色,lake_color是湖泊颜色,#46bcec是蓝色
m.drawcoastlines(linewidth=0.5)
m.drawcountries(linewidth=0.5)
m.drawstates(linewidth=0.5)
x,y=m(np.array(wtdat['long_DD']),np.array(wtdat['lat_DD']))

# plot each turbine with marker size based on machine size

# Check the number of missing values in 'MW_turbine'
print("Number of missing values in 'MW_turbine':", wtdat['MW_turbine'].isnull().sum())


mx=wtdat['MW_turbine'].max() # 最大的MW,MW_turbine表示电机的MW
for i in range(len(wtdat)):
    if wtdat['MW_turbine'].loc[i]>0:
        m.plot(x[i],y[i],'o',
            color='red',
            markersize=wtdat['MW_turbine'].loc[i]/mx*15,
            alpha=0.25,
            markeredgecolor='none')
    else:
        m.plot(x[i],y[i],
            'x',
            color='brown') # x表示叉号

plt.show()
fig.savefig('WindTurbineMap.png',orientation='landscape',dpi=600)
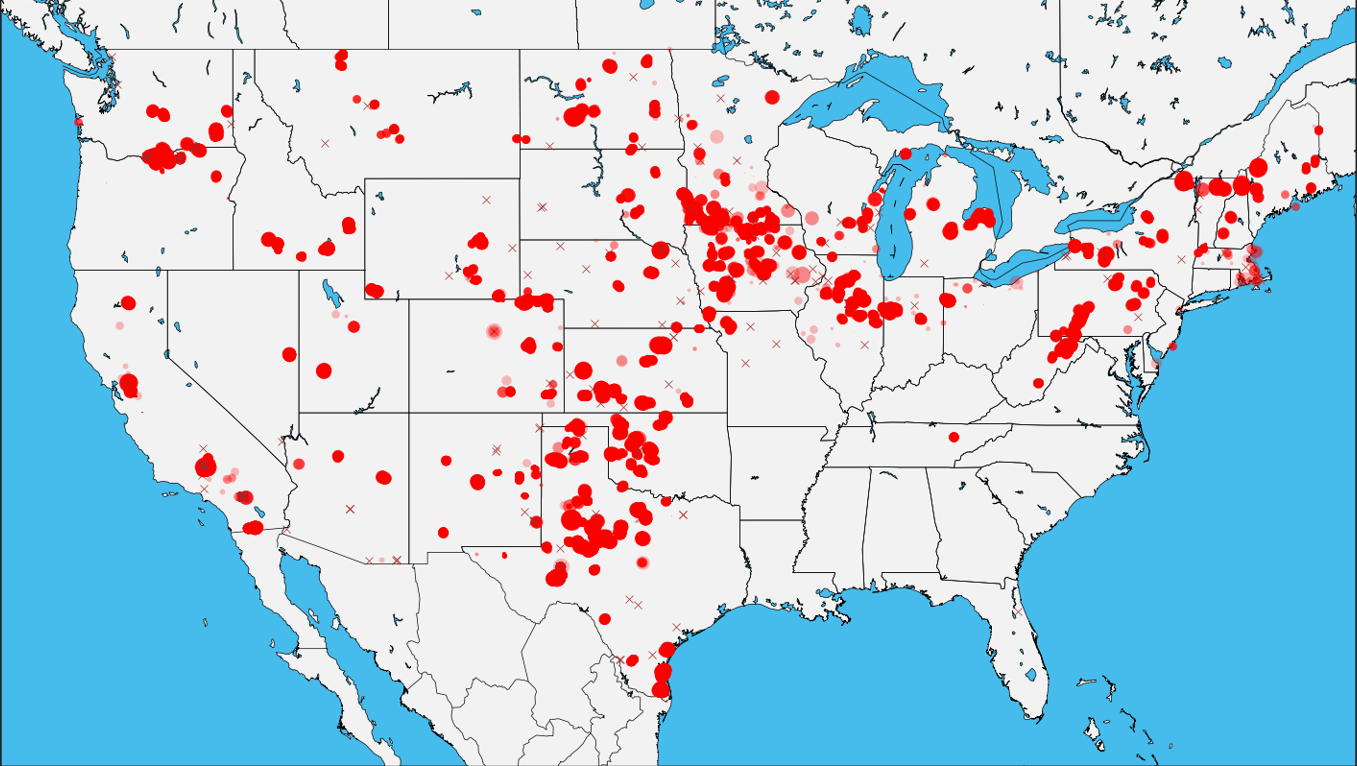
这段代码的含义是,首先设置地图的中心点,然后绘制地图,最后绘制风力发电机的位置,其中地图上的散点的大小是根据风力发电机的MW来决定的。
运行结果如下:


