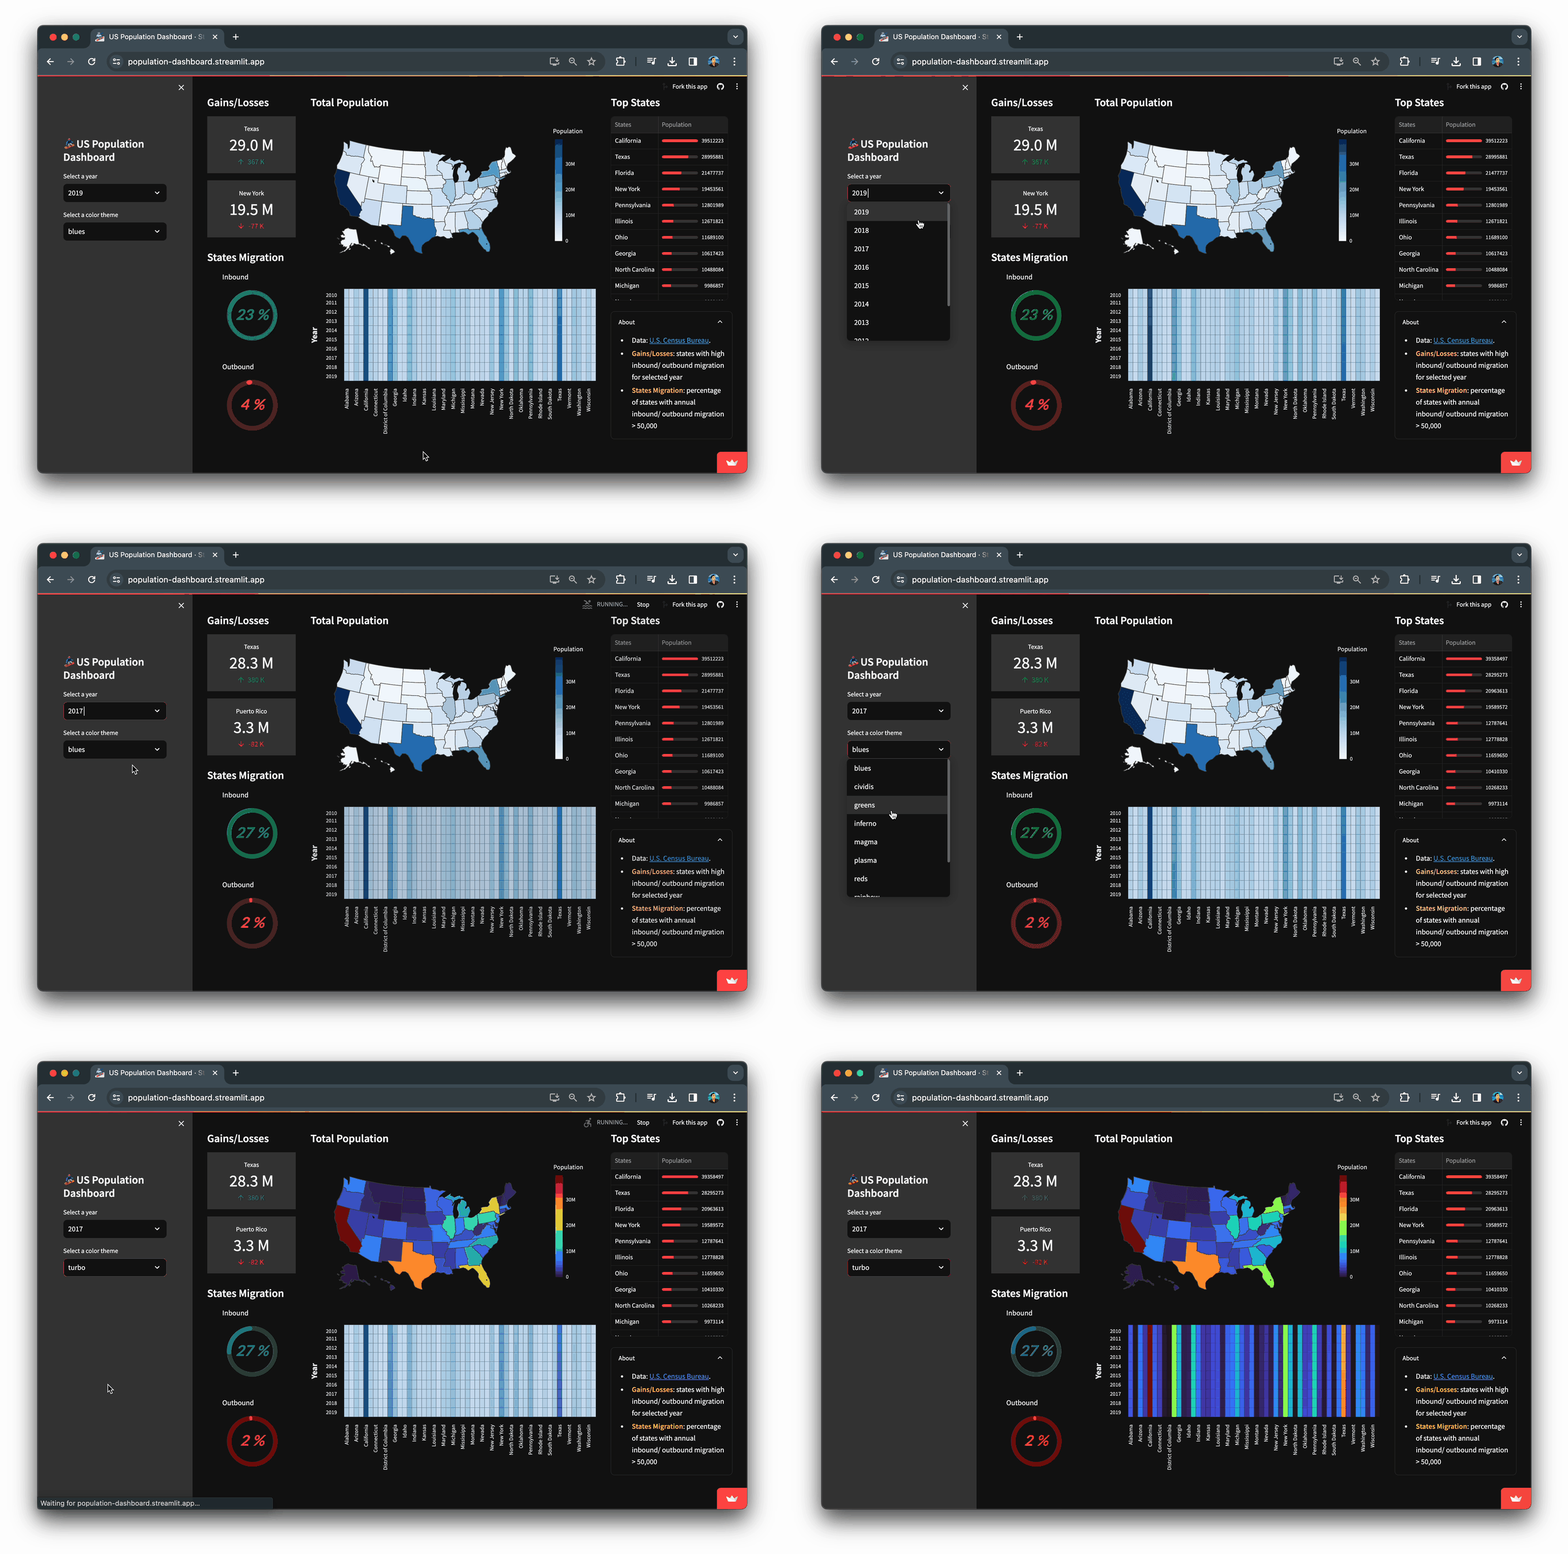
使用Python与Streamlit构建数据仪表板
结合使用pandas进行数据整理,Altair/Plotly进行数据可视化,并以Streamlit作为前端界面
发布于Tutorials标签之下,日期为2024年1月22日
您可能熟悉“一幅图画胜过千言万语”这句话,在数据科学的情境中,一张可视化的图表同样具有这样的价值。它通过对表格数据的不同视角展示,可能采用简单的折线图、直方图分布甚至是更复杂的透视图表等形式来体现这种价值。
尽管这些图表已经非常有用,但我们通常在印刷品或网络上看到的典型图表大多都是静态的。试想一下,如果能够在交互式仪表板中操控这些静态变量,将会带来多么强烈的参与感和吸引力?
🏂

在本文中,您将学习如何构建一个人口统计仪表板应用,该应用展示了从美国人口普查局获取的2010年至2019年美国人口数据及其可视化结果。
我将引导您从零开始,使用Streamlit构建这一交互式仪表板应用的前端部分。后台数据处理和分析的强大支撑则来自于诸如NumPy、Pandas、Scikit-Learn和Altair等PyData领域的重量级库。
您将学会如何:
- 定义关键指标
- 执行探索性数据分析(EDA)
- 利用Streamlit构建仪表板应用
仪表板内部包含什么?
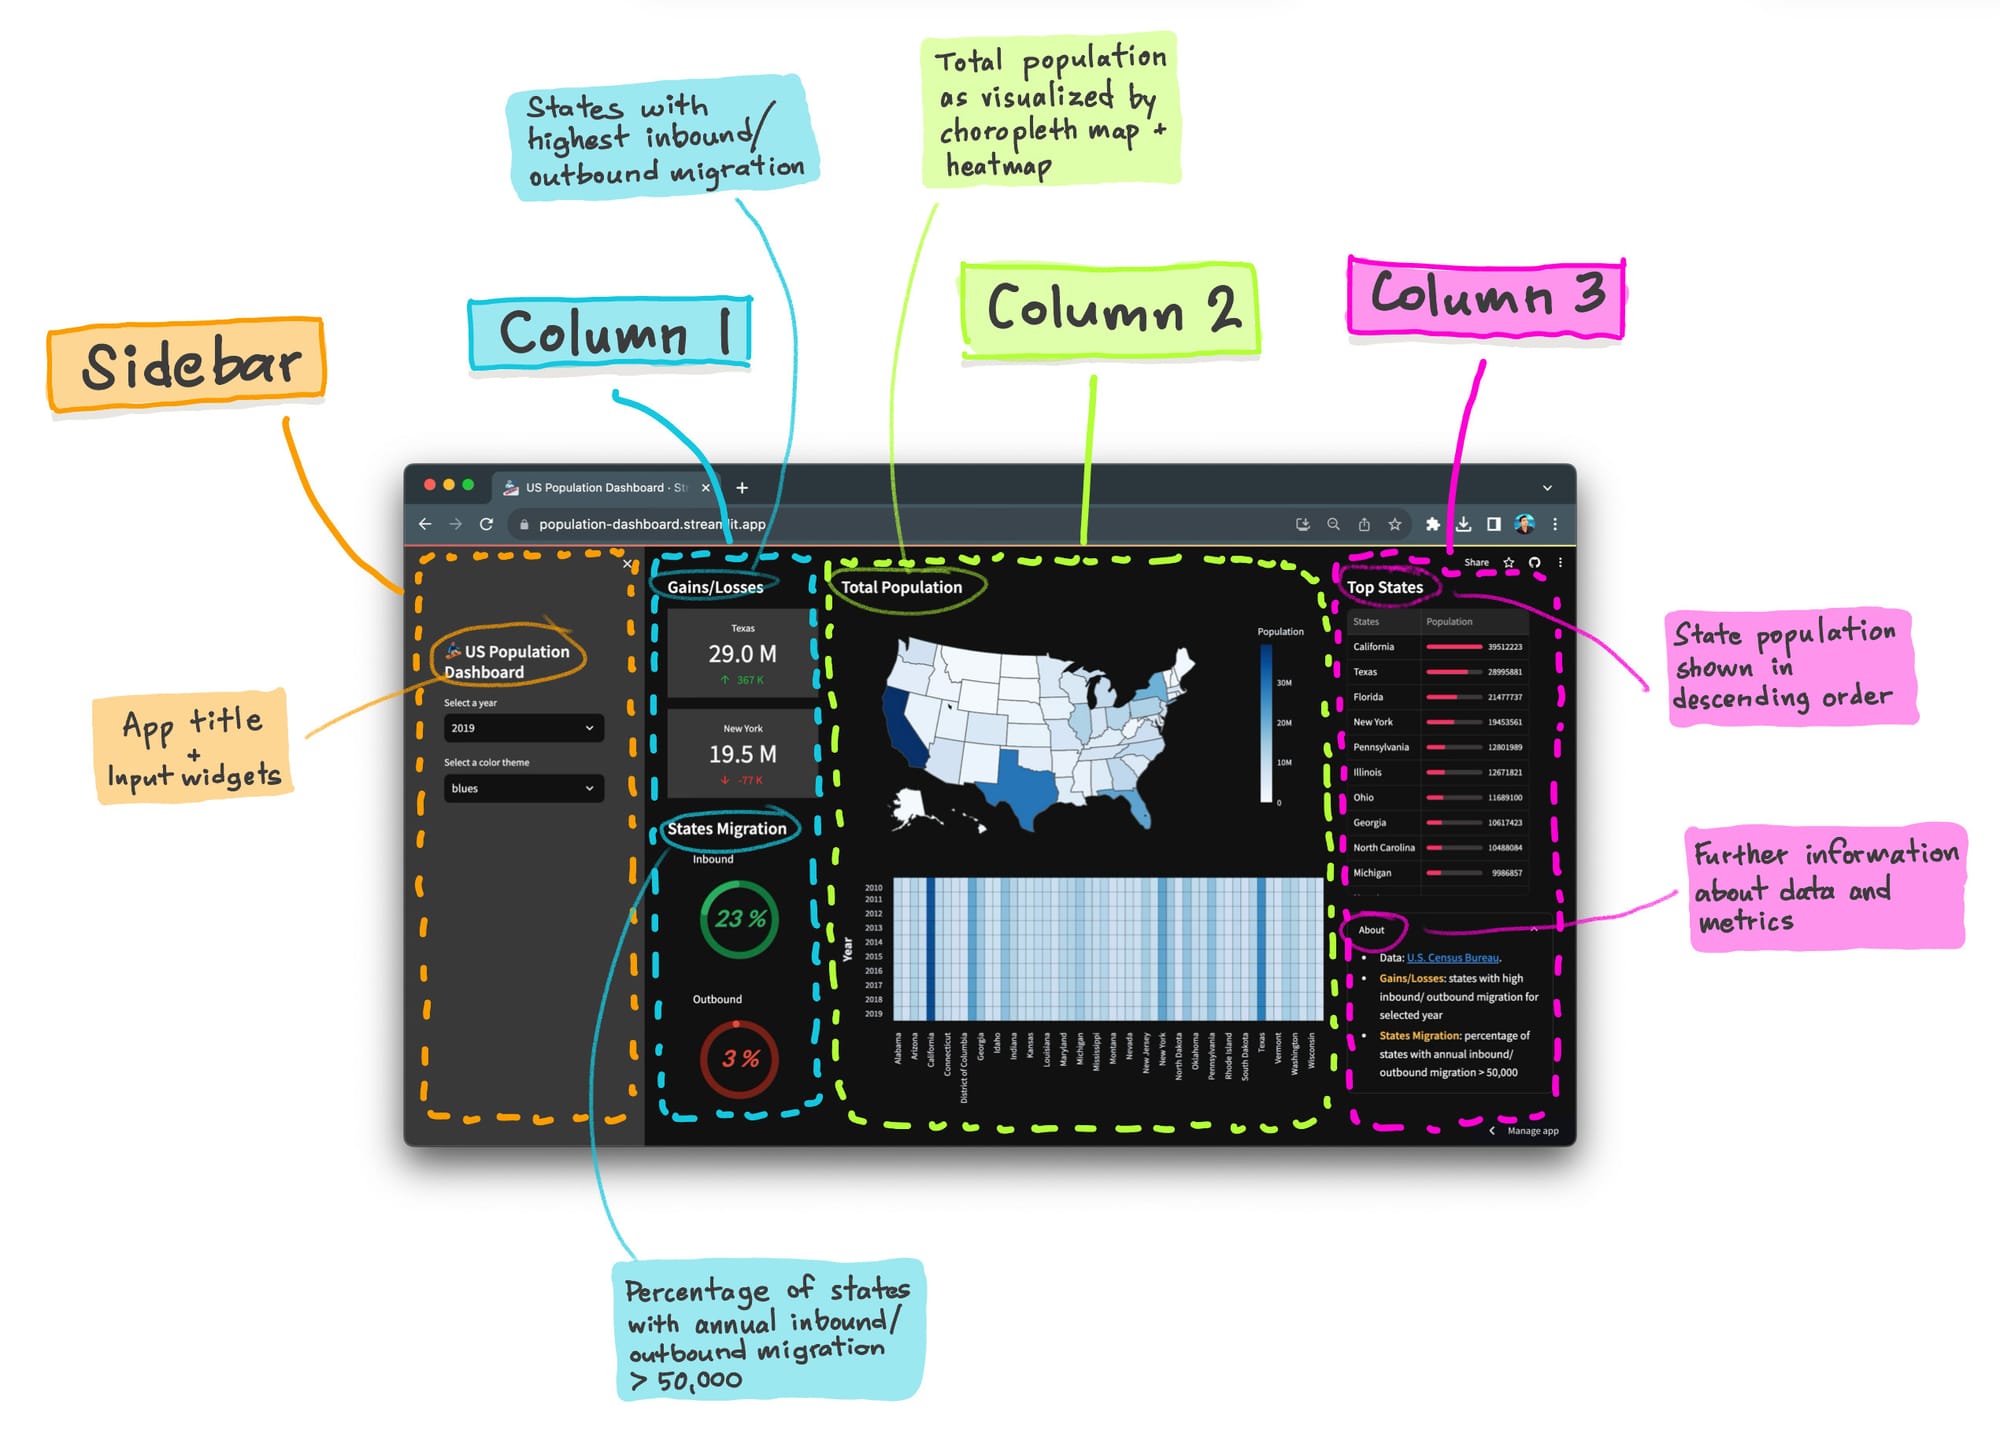
以下是对构成这款人口统计仪表板的各个组件的视觉分解:

让我们开始吧!
1. 定义关键指标
在真正构建仪表板之前,我们需要首先确定明确的指标,以便衡量重要的内容。
1.1 关键指标概述
任何仪表板的目标都是揭示有助于基于数据做决策的洞见。仪表板的主要目的是什么?这将指导后续问题,这些问题将以关键指标的形式出现在仪表板上以寻求答案。
例如:
- 在销售领域,主要目标可能是理解:“销售团队的表现如何?” 指标可能包括按销售人员划分的总营收、按区域划分的销量,或者随时间产生的新线索数量。
- 在市场营销领域,主要目标可能是理解:“我的营销活动表现如何?” 这可能包括测量领先指标,如响应率或点击率,以及滞后指标,如收入转化率或客户获取成本。
- 在财务领域,仪表板可能需要回答:“我们的业务有多盈利?” 这可能包括毛利润、运营利润率和资产回报率等指标。
1.2 本应用所选择的关键指标
这款人口统计仪表板旨在解答的主要问题是:美国各州的人口随时间是如何变化的?
我们需要提出哪些问题来帮助我们解答这个仪表板目标?
- 不同州的总人口比较如何?
- 各州人口随着时间推移如何演变,它们之间如何比较?
- 在特定的一年内,哪些州经历了超过5万人流入或流出?我们将这些标记为“流入”和“流出”迁移指标。
2. 进行 EDA 分析
一旦我们有了关键指标,我们就需要在将数据以视觉美学方式呈现在我们的仪表板上之前,收集并对可用数据有一个扎实的了解。
探索性数据分析(EDA) 可以定义为一个迭代过程,用于理解数据,其中包括通过对数据进行分析性工作来提出和回答问题。实质上,你的仪表板从一个空白画布开始,而EDA则提供了一种务实的方法,来产生引人入胜的数据可视化,讲述一个故事。
约翰·图基(John Tukey)在 1977年关于EDA的开创性工作 极其细致地为有效的数据沟通奠定了基础。以下是一些值得注意的关键要点:
- “图表的最大价值在于当它迫使我们看到我们从未预料到的东西。” 实际上,图基引入了箱线图(也称为盒须图)。
- 在处理数据时保持灵活和开放的心态,因此EDA具有“探索性”的特点。
2.1 你可用的数据是什么?
这是我们用于人口仪表板的 美国人口调查局 数据集的一个示例。有三个潜在变量(states,year 和 population)将作为我们指标的基础。
states, states_code, id, year, population
Alabama, AL, 1, 2010, 4785437
Alaska, AK, 2, 2010, 713910
Arizona, AZ, 4, 2010, 6407172
Arkansas, AR, 5, 2010, 2921964
California, CA, 6, 2010, 37319502
2.2 准备数据
将年份列合并为单个统一的列。
通过按年份对数据进行子集化,将提供生成可能的可视化(例如热力图,等值地图等)和可排序数据框架所需的格式。
2.3 选择 最佳可视化我们关键指标 的图表
现在我们对手边的数据有了更好的了解,并且了解了要衡量的关键指标,是时候决定如何在我们的仪表板上可视化结果了。有无数种方法来可视化数据集,以下是我们人口仪表板应用程序所选择的内容。
- 不同州的总人口比较如何?
- 使用 等值地图 可以增加地理空间维度,突出显示人口最多和最少的州。
- 不同州的人口如何随时间演变,并且它们之间如何比较?
- 在特定年份,有多少州的人口流入/流出超过50,000人?
- 环形图是一个带有空心内弧的饼图,我们使用它来可视化州内部迁移的百分比。
有无数种方法来可视化您的数据集!
您可以从社区不断增长的自定义组件集合中发现更多可视化选项。以下是您可以尝试的一些:
streamlit-extras提供了一系列扩展了 Streamlit 本地功能的小部件。streamlit-shadcn-ui提供了几个 UI 前端组件(模态,悬停卡片,徽章等),可以并入仪表板应用程序。streamlit-elements允许创建可拖动和可调整大小的仪表板组件。
3. Build your dashboard with Streamlit
💡
Here’s the dashboard app and the GitHub repo.
3.1 Import libraries
First, we’ll start by importing the prerequisite libraries:
- Streamlit - a low-code web framework
- Pandas - a data analysis and wrangling tool
- Altair - a data visualization library
- Plotly Express - a terse and high-level API for creating figures
import streamlit as st
import pandas as pd
import altair as alt
import plotly.express as px
3.2 Page configuration
Next, we’ll define settings for the app by giving it a page title and icon that are displayed on the browser. This also defines the page content to be displayed in a wide layout that fits the page’s width as well as showing the sidebar in the expanded state.
Here, we also set the color theme for the Altair plot to be dark in order to accompany dark color theme of the app.
st.set_page_config(
    page_title="US Population Dashboard",
    page_icon="🏂",
    layout="wide",
    initial_sidebar_state="expanded")

alt.themes.enable("dark")
3. 使用 Streamlit 构建你的仪表板
💡
3.1 导入库
首先,我们将开始导入必要的库:
- Streamlit - 一个低代码 Web 框架
- Pandas - 一个数据分析和数据处理工具
- Altair - 一个数据可视化库
- Plotly Express - 一个简洁且高级别的 API,用于创建图形
import streamlit as st
import pandas as pd
import altair as alt
import plotly.express as px
3.2 页面配置
接下来,我们将通过为应用程序指定页面标题和图标来定义应用程序的设置,在浏览器中显示。这也定义了要在宽布局中显示的页面内容以及在展开状态下显示侧边栏。
在这里,我们还设置了 Altair 图的颜色主题为深色,以配合应用程序的暗色主题。
st.set_page_config(
    page_title="US Population Dashboard",
    page_icon="🏂",
    layout="wide",
    initial_sidebar_state="expanded")

alt.themes.enable("dark")
3.3 加载数据
接下来,我们将使用 Pandas 的 read_csv() 函数将数据加载到应用程序中,如下所示:
df_reshaped = pd.read_csv('data/us-population-2010-2019-reshaped.csv')
3.4 添加侧边栏
我们现在将通过 st.title() 创建应用程序标题,并通过 st.selectbox() 创建下拉小部件,允许用户选择特定年份和颜色主题。
然后,将使用 selected_year(从2010年到2019年的可用年份)对数据进行子集化,然后在应用程序中显示。
selected_color_theme 将允许根据上述小部件指定的选定颜色对等值地图和热力图进行着色。
with st.sidebar:
    st.title('🏂 US Population Dashboard')

    year_list = list(df_reshaped.year.unique())[::-1]

    selected_year = st.selectbox('Select a year', year_list, index=len(year_list)-1)
    df_selected_year = df_reshaped[df_reshaped.year == selected_year]
    df_selected_year_sorted = df_selected_year.sort_values(by="population", ascending=False)

    color_theme_list = ['blues', 'cividis', 'greens', 'inferno', 'magma', 'plasma', 'reds', 'rainbow', 'turbo', 'viridis']
    selected_color_theme = st.selectbox('Select a color theme', color_theme_list)
3.5 绘制和图表类型
接下来,我们将定义用于创建仪表板中显示的各种图表的自定义函数。
热力图
热力图将允许我们看到2010年至2019年间52个州的人口增长情况。
def make_heatmap(input_df, input_y, input_x, input_color, input_color_theme):
    heatmap = alt.Chart(input_df).mark_rect().encode(
            y=alt.Y(f'{input_y}:O', axis=alt.Axis(title="年份", titleFontSize=18, titlePadding=15, titleFontWeight=900, labelAngle=0)),
            x=alt.X(f'{input_x}:O', axis=alt.Axis(title="", titleFontSize=18, titlePadding=15, titleFontWeight=900)),
            color=alt.Color(f'max({input_color}):Q',
                             legend=None,
                             scale=alt.Scale(scheme=input_color_theme)),
            stroke=alt.value('black'),
            strokeWidth=alt.value(0.25),
        ).properties(width=900
        ).configure_axis(
        labelFontSize=12,
        titleFontSize=12
        )
    # height=300
    return heatmap
地图图表
接下来,通过分级色彩地图展示了选定年份的52个美国州的彩色地图。
 美国人口的分级色彩地图,显示了感兴趣年份(本例中为2019年)的选定年份。
def make_choropleth(input_df, input_id, input_column, input_color_theme):
    choropleth = px.choropleth(input_df, locations=input_id, color=input_column, locationmode="USA-states",
                               color_continuous_scale=input_color_theme,
                               range_color=(0, max(df_selected_year.population)),
                               scope="usa",
                               labels={'population':'Population'}
                              )
    choropleth.update_layout(
        template='plotly_dark',
        plot_bgcolor='rgba(0, 0, 0, 0)',
        paper_bgcolor='rgba(0, 0, 0, 0)',
        margin=dict(l=0, r=0, t=0, b=0),
        height=350
    )
    return choropleth
环形图
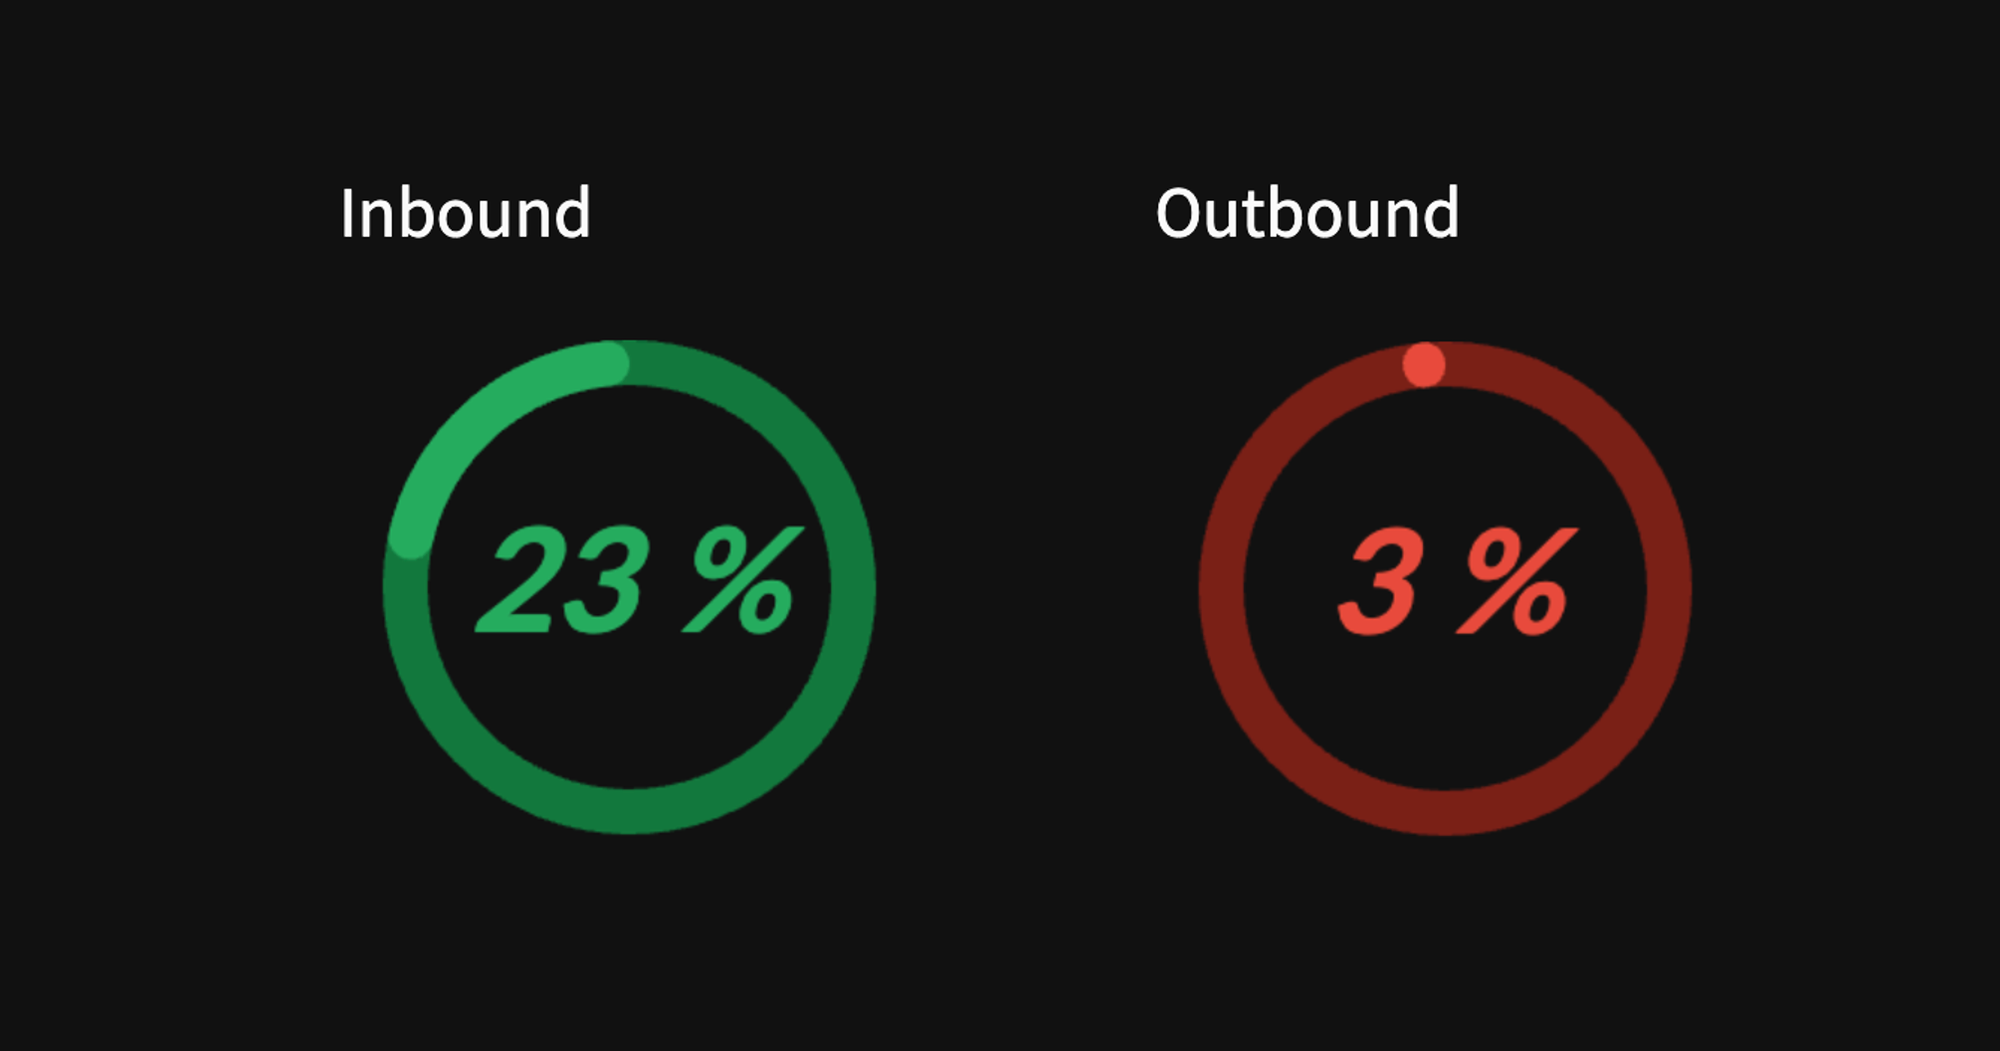
接下来,我们将为百分比显示的州迁移创建一个环形图。
 2019年州级年度入境和出境迁移人口大于50,000的州的百分比的环形图。
特别是,这代表了年度入境或出境迁移人口大于50,000的州的百分比。例如,在2019年,52个州中有12个州,占23%。
在创建环形图之前,我们需要计算年度人口迁移。
def calculate_population_difference(input_df, input_year):
  selected_year_data = input_df[input_df['year'] == input_year].reset_index()
  previous_year_data = input_df[input_df['year'] == input_year - 1].reset_index()
  selected_year_data['population_difference'] = selected_year_data.population.sub(previous_year_data.population, fill_value=0)
  return pd.concat([selected_year_data.states, selected_year_data.id, selected_year_data.population, selected_year_data.population_difference], axis=1).sort_values(by="population_difference", ascending=False)
然后,从上述州迁移百分比值创建环形图。
def make_donut(input_response, input_text, input_color):
  if input_color == 'blue':
      chart_color = ['#29b5e8', '#155F7A']
  if input_color == 'green':
      chart_color = ['#27AE60', '#12783D']
  if input_color == 'orange':
      chart_color = ['#F39C12', '#875A12']
  if input_color == 'red':
      chart_color = ['#E74C3C', '#781F16']

  source = pd.DataFrame({
      "Topic": ['', input_text],
      "% value": [100-input_response, input_response]
  })
  source_bg = pd.DataFrame({
      "Topic": ['', input_text],
      "% value": [100, 0]
  })

  plot = alt.Chart(source).mark_arc(innerRadius=45, cornerRadius=25).encode(
      theta="% value",
      color= alt.Color("Topic:N",
                      scale=alt.Scale(
                          #domain=['A', 'B'],
                          domain=[input_text, ''],
                          # range=['#29b5e8', '#155F7A']),  # 31333F
                          range=chart_color),
                      legend=None),
  ).properties(width=130, height=130)

  text = plot.mark_text(align='center', color="#29b5e8", font="Lato", fontSize=32, fontWeight=700, fontStyle="italic").encode(text=alt.value(f'{input_response} %'))
  plot_bg = alt.Chart(source_bg).mark_arc(innerRadius=45, cornerRadius=20).encode(
      theta="% value",
      color= alt.Color("Topic:N",
                      scale=alt.Scale(
                          # domain=['A', 'B'],
                          domain=[input_text, ''],
                          range=chart_color),  # 31333F
                      legend=None),
  ).properties(width=130, height=130)
  return plot_bg + plot + text
将人口转换为文本
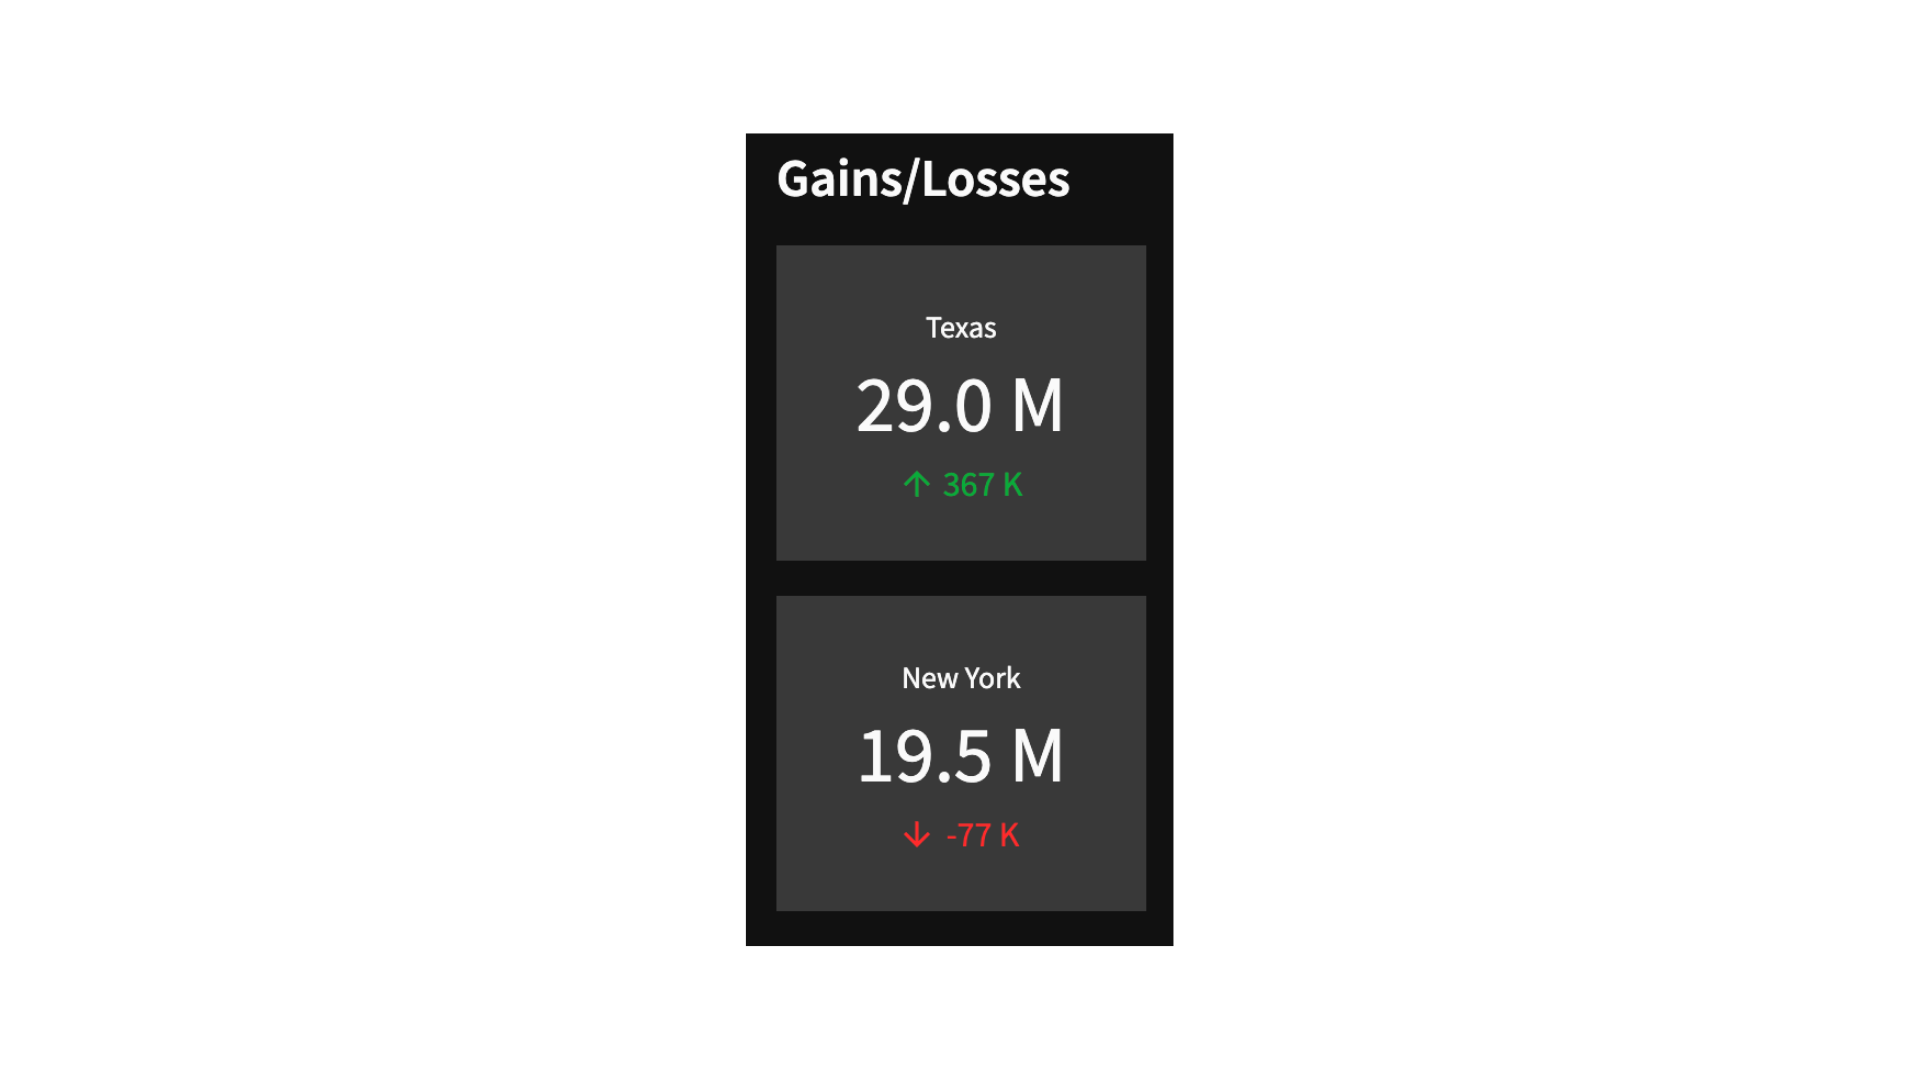
接下来,我们将创建一个自定义函数,使人口值更加简洁,并改善美观性。特别是,在指标卡中,人口被显示为数值28,995,881,而更简洁的形式为29.0 M。这也适用于千位数值。
 在所选年份中显示出入境/出境迁移较高的州的指标卡(本例中为2019年)。
def format_number(num):
    if num > 1000000:
        if not num % 1000000:
            return f'{num // 1000000} M'
        return f'{round(num / 1000000, 1)} M'
    return f'{num // 1000} K'
3.6 应用布局
最后,是时候将所有内容放在应用程序中了。
定义布局
首先创建3列:
col = st.columns((1.5, 4.5, 2), gap='medium')
特别地,输入参数(1.5, 4.5, 2)表示第二列的宽度大约是第一列的三倍,而第三列的宽度大约是第二列的一半。
第一列
在这里显示了增益/损失部分,其中指标卡显示了选定年份(通过st.selectbox创建的选择年份下拉小部件指定)中具有最高入境和出境迁移的州。
州迁移部分显示了一个环形图,显示了年度入境或出境迁移人口大于50,000的州的百分比。
with col[0]:
    st.markdown('#### Gains/Losses')

    df_population_difference_sorted = calculate_population_difference(df_reshaped, selected_year)

    if selected_year > 2010:
        first_state_name = df_population_difference_sorted.states.iloc[0]
        first_state_population = format_number(df_population_difference_sorted.population.iloc[0])
        first_state_delta = format_number(df_population_difference_sorted.population_difference.iloc[0])
    else:
        first_state_name = '-'
        first_state_population = '-'
        first_state_delta = ''
    st.metric(label=first_state_name, value=first_state_population, delta=first_state_delta)

    if selected_year > 2010:
        last_state_name = df_population_difference_sorted.states.iloc[-1]
        last_state_population = format_number(df_population_difference_sorted.population.iloc[-1])
        last_state_delta = format_number(df_population_difference_sorted.population_difference.iloc[-1])
    else:
        last_state_name = '-'
        last_state_population = '-'
        last_state_delta = ''
    st.metric(label=last_state_name, value=last_state_population, delta=last_state_delta)


    st.markdown('#### States Migration')

    if selected_year > 2010:
        # Filter states with population difference > 50000
        # df_greater_50000 = df_population_difference_sorted[df_population_difference_sorted.population_difference_absolute > 50000]
        df_greater_50000 = df_population_difference_sorted[df_population_difference_sorted.population_difference > 50000]
        df_less_50000 = df_population_difference_sorted[df_population_difference_sorted.population_difference < -50000]

        # % of States with population difference > 50000
        states_migration_greater = round((len(df_greater_50000)/df_population_difference_sorted.states.nunique())*100)
        states_migration_less = round((len(df_less_50000)/df_population_difference_sorted.states.nunique())*100)
        donut_chart_greater = make_donut(states_migration_greater, 'Inbound Migration', 'green')
        donut_chart_less = make_donut(states_migration_less, 'Outbound Migration', 'red')
    else:
        states_migration_greater = 0
        states_migration_less = 0
        donut_chart_greater = make_donut(states_migration_greater, 'Inbound Migration', 'green')
        donut_chart_less = make_donut(states_migration_less, 'Outbound Migration', 'red')

    migrations_col = st.columns((0.2, 1, 0.2))
    with migrations_col[1]:
        st.write('Inbound')
        st.altair_chart(donut_chart_greater)
        st.write('Outbound')
        st.altair_chart(donut_chart_less)
第二列
接下来,第二列使用之前创建的自定义函数显示分级色彩地图和热力图。
with col[1]:
    st.markdown('#### Total Population')

    choropleth = make_choropleth(df_selected_year, 'states_code', 'population', selected_color_theme)
    st.plotly_chart(choropleth, use_container_width=True)

    heatmap = make_heatmap(df_reshaped, 'year', 'states', 'population', selected_color_theme)
    st.altair_chart(heatmap, use_container_width=True)
第三列
最后,第三列通过数据框显示了前几个州,其中人口通过st.dataframe的column_config参数显示为彩色进度条。
通过st.expander()容器显示了一个关于部分,提供了有关数据源和仪表板中使用的术语的定义信息。
with col[2]:
    st.markdown('#### Top States')

    st.dataframe(df_selected_year_sorted,
                 column_order=("states", "population"),
                 hide_index=True,
                 width=None,
                 column_config={
                    "states": st.column_config.TextColumn(
                        "States",
                    ),
                    "population": st.column_config.ProgressColumn(
                        "Population",
                        format="%f",
                        min_value=0,
                        max_value=max(df_selected_year_sorted.population),
                     )}
                 )

    with st.expander('About', expanded=True):
        st.write('''
            - Data: [U.S. Census Bureau](<https://www.census.gov/data/datasets/time-series/demo/popest/2010s-state-total.html>).
            - :orange[**Gains/Losses**]: states with high inbound/ outbound migration for selected year
            - :orange[**States Migration**]: percentage of states with annual inbound/ outbound migration > 50,000
            ''')
3.7 将仪表板应用部署到云端
有关在部署Streamlit应用程序的视频教程,请查看此教程。
BONUS: 创建仪表板时的5个提醒
- 进行EDA以获得数据理解
- 确定用于跟踪重要指标的关键指标
- 决定最佳可视化关键指标的图表
- 将相关指标分组在一起
- 使用清晰简洁的标签描述指标
总结
总而言之,Streamlit为在Python中构建交互式仪表板应用程序提供了一种快速、高效且友好的代码方式,使其成为数据科学家和开发人员在数据可视化方面的首选工具。


